

How to Generate System Diagnostics Report in Windows 10
A system diagnostics report is a part of Performance Monitor that details the status of local hardware resources, system response times, and processes on the local computer along with system information and configuration data. This report includes suggestions for ways to maximize performance and streamline system operations.
When the report is generated, you will see a list of: the status of any critical components on the computer, whether or not the problem has been detected, and any possible solutions you can try. This can be a very useful tool for troubleshooting problems and for a great source of information on your system.
Each category shown in a system diagnostics report can be expanded by clicking on the button on the far right. Categories include:
- System Diagnostics Report - Displays title, computer name, date and time the report was collected, and duration to generate the report.
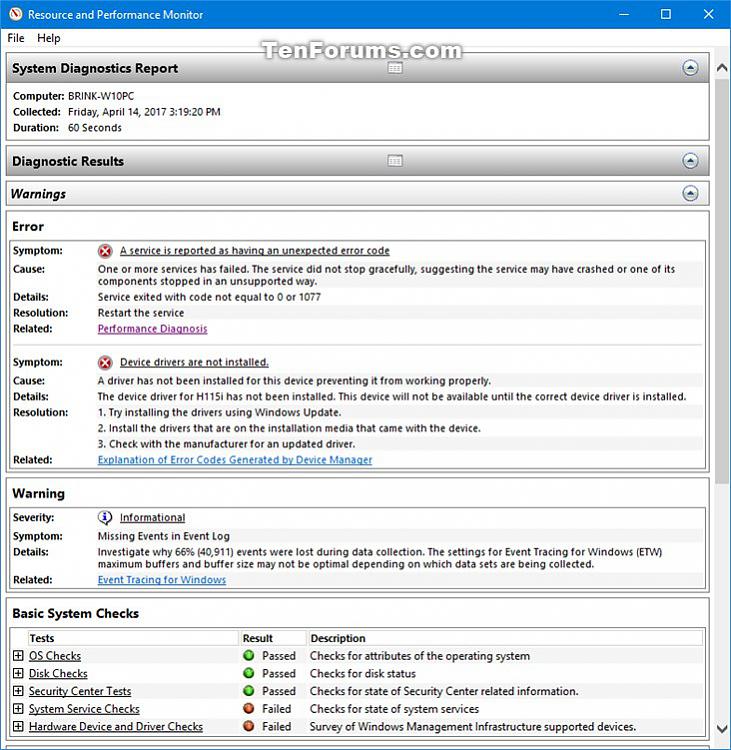
- Diagnostic Results - Shows you warnings for errors and basic system checks, and gives a resource overview of performance.
- The Warning area will display different warning and informational events. Device and Service failures are also displayed. There are hyperlinks that you can use to get additional information about resolving issues. You can also expand each of the sections under the Basic System Checks section to get more details.
- The Performance area provides process-level detail about the top consumers of resources for CPU, Disk, Network and Memory. If there are any performance related issues, the status indicator would change, and you would need to expand out the relevant section in the report for the component that reported a problem.
- Software Configuration - Checks on the OS, Security Center, system services and data on start-up programs.
- Hardware Configuration - Checks on the disks, system, desktop rating (Windows Experience Index), BIOS, devices, interactive session processes, logged on users and user accounts.
- CPU - Includes checks and information on processor, CPU unit type, CPU interrupts, services and system.
- Network - Includes checks and information on outbound and inbound traffic.
- Disk - Includes checks and information on hot files (those causing the most disk IOs), disk breakdown, physical disk and NTFS performance.
- Memory - Includes checks and information on process and counters.
- Report Statistics - Displays details about the computer information, files, and processed events.
This tutorial will show you how generate and view a system diagnostics report in Windows 10.
You must be signed in as an administrator to be able to generate and view a system diagnostics report.
Contents
- Option One: To Generate and View a System Diagnostics Report using a Command
- Option Two: To Generate a System Diagnostics Report in Performance Monitor
- Option Three: To View a System Diagnostics Report in Performance Monitor
This option appears to no longer work starting with Windows 10 version 2004 and higher.
1 Open Run (Win+R) or a command prompt.
2 Type theperfmon /reportcommand into Run or the command prompt, and press Enter.
3 This report will now start collecting data for 60 seconds. It may take up to an additional 60 seconds for the report to be generated. (see screenshot below)
4 When finished, the system diagnostics report will now be displayed for you to review. (see screenshots below)
1 Press the Win + R keys to open Run, type perfmon into Run, and click/tap on OK to open Performance Monitor.
2 Expand open Data Collector Sets and System in the left pane of Performance Monitor, right click press and hold on System Diagnostics, and click/tap on Start. (see screenshot below)
3 This report will now start collecting data for 60 seconds. It may take up to an additional 60 seconds for the report to be generated. (see screenshots below)
4 When finished, you can view the system diagnostics report using Option Three below. (see screenshot below)
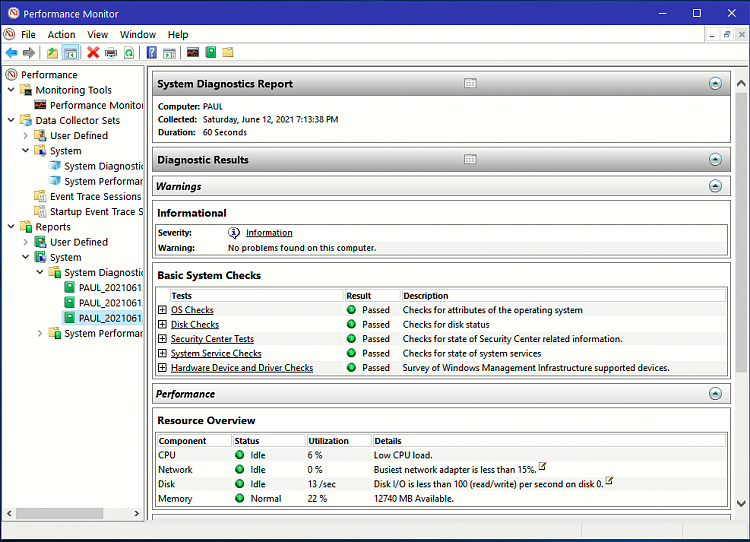
1 Press the Win + R keys to open Run, type perfmon into Run, and click/tap on OK to open Performance Monitor.
2 Expand open Reports, System, and System Diagnostics in the left pane of Performance Monitor. (see screenshot below)
3 Under System Diagnostics, click/tap on a report that was created (collected) on the date and time you want to view.
That's it,
Shawn Brink
Related Tutorials
- How to Generate System Performance Report in Windows 10
- How to Generate Battery Usage Report in Windows 10
- How to Generate Battery Energy Estimation Report in Windows 10
- How to Create a Power Efficiency Diagnostics Report in Windows 10
- How to Generate a System Sleep Diagnostics Report in Windows 10
- How to Generate a Sleep Study Report in Windows 10
- How to Get Windows Experience Index (WEI) Score in Windows 10
Generate System Diagnostics Report in Windows 10
-
New #1
Good one Shawn!
Additionally one can call it up from Cortana or Windows search(Windows key or icon)

or from inside or File Explorer(like many System32 commands)
-
-
New #3
I finally fixed a problem.
The DRAM tweaking service in MSI Command Center(MSIDDRService.exe) was getting errors that showed up MANY times a day in Reliability History.
I only used it to turn up the fans, and didn't use it anyhow for OCing(Steve & Doug taught me it's better to overclock through BIOS than software inside of Windows), so I just created a slightly more aggressive fan curve for temps over 65°C in BIOS, then uninstalled Command Center:)
Now no more Red Lights

-
New #4
Problem generating System Diagnostics Report in Windows 10 Home
Good Day, I have tried to run this report on a newly built computer and can't get it to work. When typing "perfmon /report" the "collecting data" under the green bar graph never stops nor generates a report even after waiting 20 minutes. When typing "perfmon" in the run window and following the steps in Option Two, after I click on start, I get an error message as shown in the attachment which says "The Data Collector Set or one of it's dependencies is already in use."
I'm new here and would appreciate any help on how to resolve my issue.
Thank you!

-
-
New #6
Hi Brink,
I tried that last night as well as this morning and did not make any difference. The message below was in the top part of the
Resource Monitor as shown in the attachment. I am signed in as administrator as I set it up that way when I built the computer about a month ago.
"Membership in the local Administrators group, or equivalent, is the minimum required to run this Data Collector Set."
-
-
New #8
Tried the elevated prompt and made no difference. I wonder if MS changed something in Win 10 since this article was written that effects the later version I'm running. I also have a laptop running Win 10 that's probably close to 10 years old and was a Win 8 machine originally until Win 10 was first offered for free. I upgraded it to Win 10 at that time. It has a disk drive where my new computer is using a SSD.
Something is certainly strange here and appears others are having the same issue. Hope a fix can be found.
-
-
New #9
Aviator52 hello. . .
Can you open Performance Monitor, then configure it. . . so it looks somewhat like this ?

I just ran the program, and got this. . .
It seems to work as it should. . . .
Oh, I also open it from here. . .

Which is the same place as in the Control Panel, under Administrative Tools.

.

Generate System Diagnostics Report in Windows 10
How to Generate System Diagnostics Report in Windows 10Published by Shawn BrinkCategory: Performance & Maintenance
14 Jun 2021


 Quote
Quote


Tutorial Categories

Related Discussions
