

How to Generate a Sleep Study Report in Windows 10
A Sleep Study report is tool available on Windows 10 PCs that support the Modern Standby (S0 low power idle) sleep state.
A Sleep Study generates a report of connected standby (aka: "InstantGo" and "Modern Standby") quality over the last three days on the system.
Sleep Study tells you how well the system slept and how much activity it experienced during that time. While in the sleep state, the system is still doing some work, albeit at a lower frequency. Because the resulting battery drain is not easily perceptible (you cant see it draining), we built the Sleep Study tool in Windows 10 to allow you to track what is happening. We thought of simply using traditional logging to do this, but ironically, the logging itself would drain the battery. With this in mind, we designed the Sleep Study tool to minimize its own impact on battery life, while tracking the battery draining activities.
You can use Sleep Study to see which apps and devices are most active during a sleep session. Sleep Study reviews all the sleep sessions longer than 10 minutes and provides you with a report that color codes each session according to its power consumption. A session is defined as the period from Screen Off to Screen On. In cases when the system is plugged into AC power, the policies are less stringent than when on battery power. While the tool still tracks connected standby activity on AC power, it is more useful to identify unexpected drains on battery, or DC power.
To help you easily identify apps, devices and services with higher power consumption, these are highlighted in red or orange in the report, and represent opportunities to extend your battery life.
See also: Modern standby SleepStudy | Microsoft Docs > Windows Hardware Developer
This tutorial will show you how to generate a Sleep Study report for Modern Standby quality in Windows 10.
You must be signed in as an administrator to be able to generate a Sleep Study report.
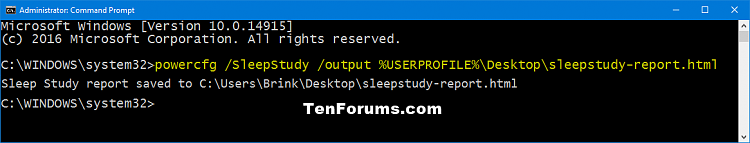
EXAMPLE: "powercfg /SleepStudy" usage
Here's How:
1 Open an elevated command prompt.
2 Type the command you want to use below into the elevated command prompt, and press Enter. (see screenshots below)
It's recommended to save the report as a .html file to be able to easily use and read it.
(For .html file with default 3 day duration)
powercfg /SleepStudy /output %USERPROFILE%\Desktop\sleepstudy-report.html
(For .html file with specified duration)
powercfg /SleepStudy /output %USERPROFILE%\Desktop\sleepstudy-report.html /Duration days
(For .xml file with default 3 day duration)
powercfg /SleepStudy /output %USERPROFILE%\Desktop\sleepstudy-report.xml /XML
(For .xml file with specified duration)
powercfg /SleepStudy /output %USERPROFILE%\Desktop\sleepstudy-report.xml /XML /Duration days
Substitute days in the commands above with a number 1 to 14 to specify the number of days you want to analyze for the report.
3 Open the sleepstudy-report.html or sleepstudy-report.xml file saved to your desktop to see the report in your default web browser (ex: Internet Explorer).
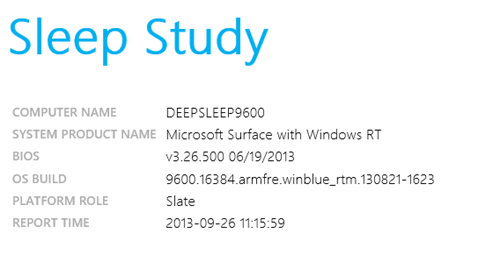
4 This is an example System Sleep report from a sleepstudy-report.html file viewed in Internet Explorer. (see screenshots below)
Note
The Sleep Study HTML output is designed so you can easily read and interpret it. The sections are:
- Machine information
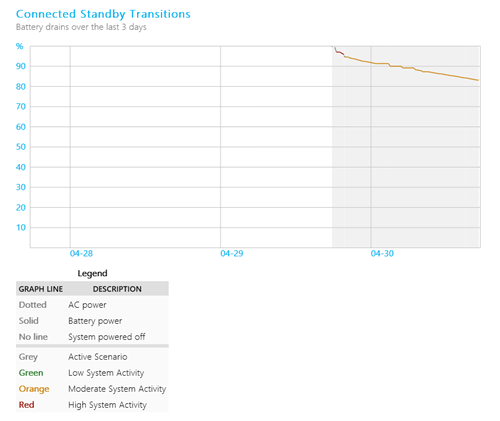
- Battery drain chart
- Chart Legend
- Connected standby session summary table
- Connected standby session 1
- Session #1 summary
- Top 5 duration activities
- Detailed breakdown of sub components
- Connected standby session 2
- (Repeat for each subsequent session).
- Battery information
Machine information
Battery drain chart
- Green lines are well performing sessions
- Orange lines are moderate performing sessions
- Red lines are poor performing sessions
- Dotted Lines are on AC (wall charger)
- Solid lines are on DC (battery)
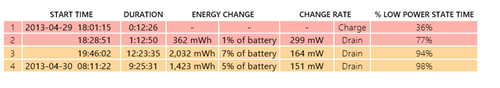
Connected standby session summary table
- Sessions are numbered sequentially
- START TIME is in YYYY-MM-DD HH:MM:SS, using 24-hour format
- State is a hyperlink to the session, in this case, all connected standby sessions
- DURATION is in HH:MM:SS. Durations under 10 minutes are filtered out of this report
- ENERGY CHANGE is in milli-watts per hour and as % of battery capacity
- CHANGE RATE is in mW over an hour interval
- "Charge/Drain" determines if it was an AC or DC session. Drain is DC; Charge is AC.
- % LOW POWER STATE TIME is the % of time spent in Deepest Runtime Idle Platform State (DRIPS %)
- Some systems may also have an analogous hardware state for DRIPS %
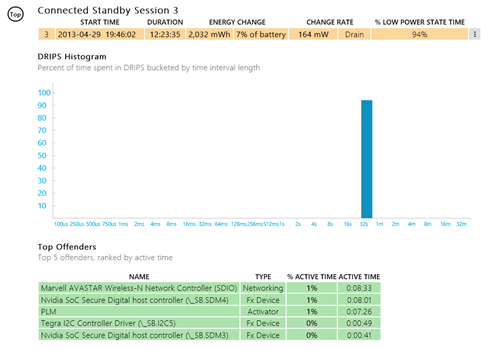
Per session details
- Per Session Summary repeats the above vital statistics.
- The top 5 offenders are listed in terms of duration.
- Detailed information on:
- Activator (Software component)
- Device (hardware component)
- PDC phases (connected standby system activity)
- Networking (In depth breakdown of networking durations by NDIS clients)
- Histogram of duration between CPU wake periods
- Periods of 32 seconds or longer are optimal for battery savings
Advanced statistics are displayed by clicking the three dots in the rightmost gray box. The statistics shown in the resulting list vary according to system capabilities.
High-drain sleep sessions
Some connected standby sessions are expected to have activity that results in battery drain. Examples where we expect higher than average drain include:
- Getting and installing Windows Update while the system sleeps
- Having peripherals plugged into the USB port (hubs, disks, keyboards, mice, network adapters)
- Having Bluetooth connected devices while the screen is off
- Playing music with the screen off
- Poor WLAN environment or unreliable network connections
- High network activity (Skype calls, emails, downloads)
- Short sleep sessions that dont allow the system to settle into idle
- Having a poorly behaving device driver
- Other low-level software bugs in drivers, firmware, or system services
Microsoft allows the system to support the experiences you care about, but with the Sleep Study tool, now you can better understand the associated battery drain. You can then make an informed decision around battery costs of certain activities. Of course, its also a relatively user friendly tool you can use to isolate any unexpected battery drains.
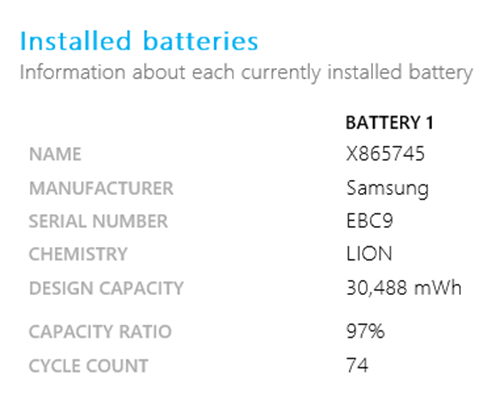
Battery information
- DESIGN CAPACITY tells you the size of the battery, in this case close to 30.5 watt hours (or 30,488 milliwatt hours)
- CAPACITY RATIO tells you how much energy can be stored in the battery before it is considered full.
- If low, the battery will have shorter battery life due to reduced capacity (for example, if the battery chemistry degrades)
- Drain rates are based on percentage of (Design Capacity * Capacity Ratio)
That's it,
Shawn Brink
Related Tutorials
- How to Put Your Computer to Sleep in Windows 10
- How to Change Computer Sleep After Time in Windows 10
- How to See Sleep States Available on your Windows 10 PC
- How to Generate a System Sleep Diagnostics Report in Windows 10
- How to Generate Battery Usage Report in Windows 10
- How to Generate Battery Energy Estimation Report in Windows 10
- How to Create a Power Efficiency Diagnostics Report in Windows 10
- How to Add 'System unattended sleep timeout' to Power Options in Windows 10
- How to Add 'Allow sleep with remote opens' to Power Options in Windows 10
- How to Generate System Diagnostics Report in Windows 10
- How to Generate System Performance Report in Windows 10
- How to Add or Remove 'Sleep after' from Power Options in Windows
- How to Check if Modern Standby is Supported in Windows 10
- How to Check if Connected or Disconnected Modern Standby in Windows 10
- How to Enable or Disable Network Connectivity while in Modern Standby in Windows 10
Generate Sleep Study Report in Windows 10
-
-
-
New #3
Good Tut :) easier to follow than the one's M$ provides to diagnose your Surface...... Sleep Study worked well for me several months ago to figure out it was Wifi on my Surface 3 that was killing the Battery even when Sleeping , so I have disabled Wifi in SleepMode ( stay connected ) and the Battery is as you would expect , it's last days with light usage , not just overnight.
KB
-
New #4
An old thread but still useful.
Hello Shawn would this facility be able to tell you why sleep is not working or having problems?
-
New #5
Hello @techquest,
It's one of many tools that can be used that may help to ID the cause of the sleep issue.
You might also generate a system sleep diagnostics report below to see if it may also add any helpful information.
Generate System Sleep Diagnostics Report in Windows 10
If the reports don't help any, I would recommend to create a new thread for the sleep issue with as much details as possible to see if a solution may be found.
-
New #6
Thanks for the response I will try out your suggestions and see what happens. If no luck then I will generate the new thread as you suggest.Last edited by techquest; 02 Dec 2019 at 10:58.
-
New #7
There is a typo in this command:
Code:(For .html file with default 3 day duration) powercfg /SleepStudy /output %USERPROFILE%\Desktop\sleepstudy-report.html (For .html file with specified duration) powercfg /]SleepStudy /output %USERPROFILE%\Desktop\sleepstudy-report.html /Duration days
Also the sleep study report title appeared as:
System Power Report
The image:
Machine Information
Sleep Study
was not seen
States:
All Active Screen Off Sleep Hibernate Shutdown Bug Check
Sleep was selected.
-
-
Generate Sleep Study Report in Windows 10
How to Generate a Sleep Study Report in Windows 10Published by Shawn BrinkCategory: Performance & Maintenance
20 Mar 2022


 Quote
Quote
Tutorial Categories

Related Discussions
