

How to Open Microsoft Edge Developer Tools in Windows 10
Browser tooling has come a long way since the days of Internet Explorer! The Microsoft Edge Developer Tools are built with TypeScript, powered by open source, and optimized for modern front-end workflows.
The Microsoft Edge DevTools include:
- An Elements panel to edit HTML and CSS, inspect accessibility properties, view event listeners, and set DOM mutation breakpoints
- A Console to view and filter log messages, inspect JavaScript objects and DOM nodes, and run JavaScript in the context of the selected window or frame
- A Debugger to step through code, set watches and breakpoints, live edit your code, and inspect your web storage and cookie caches
- A Network panel to monitor and inspect requests and responses from the network and browser cache
- A Performance panel to profile the time and system resources required by your site
- A Memory panel to measure your use of memory resources and compare heap snapshots at different states of code execution
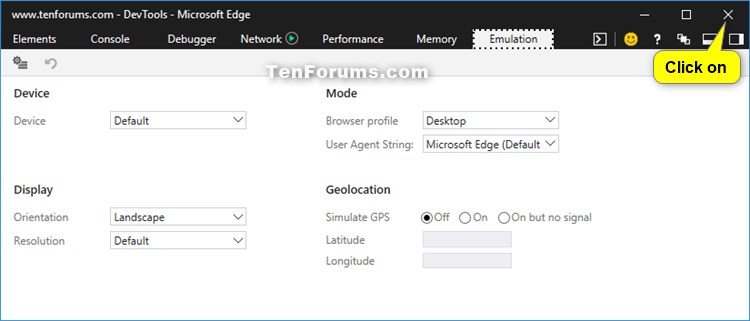
- An Emulation panel to test your site with different browser profiles, screen resolutions, and GPS location coordinates
These shortcuts control the main DevTools window and/or work across all tools.
Action Shortcut Show/Hide DevTools (opens to last viewed panel) F12, Ctrl+Shift+I Show non-editable HTML source code in Debugger Ctrl+U Show/hide Console at the bottom of any other tool Ctrl+` Switch to Elements (DOM Explorer) Ctrl+1 Switch to Console Ctrl+2 Switch to Debugger Ctrl+3 Switch to Network Ctrl+4 Switch to Performance Ctrl+5 Switch to Memory Ctrl+6 Switch to Emulation Ctrl+7 Help Document F1 Next tool Ctrl+F6 Previous tool Ctrl+Shift+F6 Previous tool (from history) Ctrl+Shift+[ Next tool (from history) Ctrl+Shift+] Next Subframe F6 Previous Subframe Shift+F6 Next match in Search box F3 Previous match in Search box Shift+F3 Find in search box Ctrl+F Give focus to console at the bottom Alt+Shift+I Dock/undock tools (toggle docking) Ctrl+P Launch DevTools to Console Ctrl+Shift+J Refresh the page. Note: if you're debugging and paused at a breakpoint, this resumes execution first. Ctrl+Shift+F5 or Ctrl+R
This tutorial will give you details about and how to open Microsoft Edge Developer Tools in Windows 10.
- Option One: Open and Close Microsoft Edge Developer Tools using Keyboard Shortcut
- Option Two: Open and Close Microsoft Edge Developer Tools from "Settings and More" menu
- Option Three: Directly Close Microsoft Edge Developer Tools
EXAMPLE: Microsoft Edge Developer Tools
1. While using Microsoft Edge, press the F12 key to toggle open and close of Developer Tools.
1. While using Microsoft Edge, click/tap on the Settings and more (Alt+X) (3 dots) button, click/tap on Moore tools, and click/tap on Developer Tools to toggle open and close of Developer Tools. (see screenshot below)
If Developer Tools is undocked from Microsoft Edge, it will not close using this option.
1. Click/tap on the Close (X) button in Developer Tools. (see screenshot below)
That's it,
Shawn
Open Microsoft Edge Developer Tools in Windows 10

Open Microsoft Edge Developer Tools in Windows 10
How to Open Microsoft Edge Developer Tools in Windows 10Published by Shawn BrinkCategory: Browsers & Email
21 May 2021


Tutorial Categories
Related Discussions
