New
#11
Windows Performance Analyzer error
-
-
New #12
My friend, thank you very much for your precious time and effort, to help me resolving this.
I'm afraid, we're running out of options here. And I definitely don't want to take advantage of your time.
Which means that WPT cannot provide what is meant for...a usable trace.
Maybe i should try my luck with Sysinternals ProcMon.
Again, thanks a lot!!!
Last edited by ddelo; 31 May 2018 at 12:31.
-
New #13
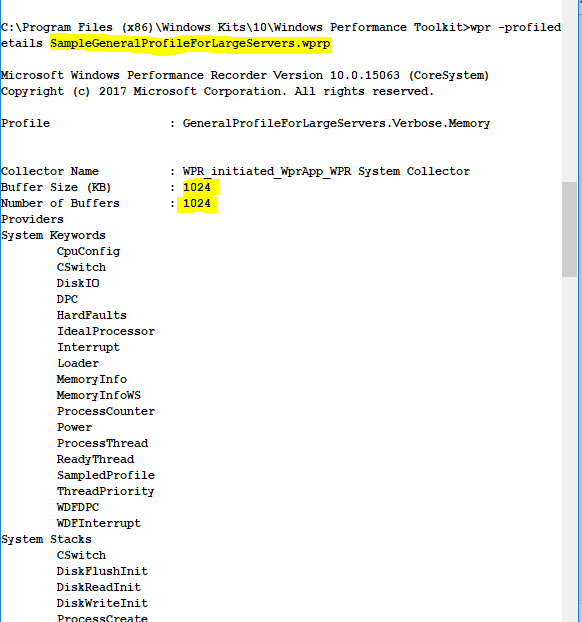
Try using the "SampleGeneralProfileForLargeServers.wprp" instead of generalprofile. it's predefined profile you can find under the toolkit folder:
wpr -start SampleGeneralProfileForLargeServers.wprp -onoffscenario Boot -onoffresultspath E:\wpr -numiterations 1 -filemode
It offers more buffer numbers:

-
New #14
Procmon is a great tool, but it's not handy to use for solving boot performance. I prefer WPT.
You know that even with lost events you can get clues on what's cause the delay. the analysis will not be so accurate, but I've already solved problems from boot traces with events dropped.
You can share your boot trace, I will try to take a look and see if we can get something interesting...
-
-
-
-
New #18
And to close the issue, after the expert advice of @zinou
In case someone has the same issue, with lots of dropped events, the solution is to start both the built-in GeneralProfile and the example profile everybody has in the "%programfiles(x86)%\Windows Kits\10\Windows Performance Toolkit" folder called SampleGeneralProfileForLargeServers.wprp.
This sample profile has 1024 buffers of 1024KB each and can record without any problem and of course without dropped events!
So the command for starting the recording of the trace should be:
Code:"%programfiles(x86)%\Windows Kits\10\Windows Performance Toolkit\wpr.exe" -start SampleGeneralProfileForLargeServers.wprp -start GeneralProfile -filemode -onoffscenario Boot -onoffresultspath C:\WPR -numiterations 1
Again a great thanks to our WPR/WPA expert @zinou.Last edited by ddelo; 31 May 2018 at 12:35.
-
Related Discussions

 I think the number of buffers is not related to the WPT version, but to the machine memory size. I've 16 Gb on my machine. I think the lower the memory you have, the lower the number of buffers.
 Quote
Quote
