Help needed with Excel Chart


  1. Posts : 298
    Win10 10.0.18362 Build 18362
       #1

    Help needed with Excel Chart


    i can draw Excel Chart in Figure 1, but i want to add red circles to Excel Chart like shown in Fig 2 which i dont know how to do???????

    Help needed with Excel Chart-fig-1.jpgHelp needed with Excel Chart-fig-2.jpg
      My Computer


  2. Posts : 11,247
    Windows / Linux : Arch Linux
       #2

    makhan10 said:
    i can draw Excel Chart in Figure 1, but i want to add red circles to Excel Chart like shown in Fig 2 which i dont know how to do???????

    Help needed with Excel Chart-fig-1.jpgHelp needed with Excel Chart-fig-2.jpg
    Hi there

    I think if you follow this -- should at least help you get started.

    Excel Worksheet Objects

    Cheers
    jimbo
      My Computer


  3. Posts : 16,949
    Windows 10 Home x64 Version 22H2 Build 19045.4170
       #3

    1 Click on your line to select it
    2 Right-click and select Format data series
    3 Select Marker options, Built-in, Type - circle
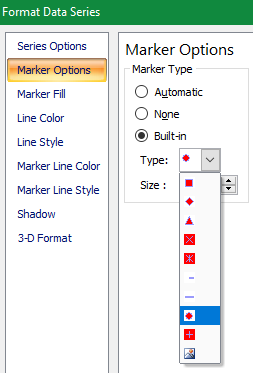
    Help needed with Excel Chart-marker-options-built-type-circle.png
    4 Still in Marker options, Built-in, select a Size to suit you. Size 10 is pretty big and is roughly what you have drawn.
    5 Then Marker fill, No fill will match your illustration's circles but you can experiment to suit your needs.

    Denis
      My Computer


  4. Posts : 298
    Win10 10.0.18362 Build 18362
    Thread Starter
       #4

    Try3 said:
    1 Click on your line to select it
    2 Right-click and select Format data series
    3 Select Marker options, Built-in, Type - circle
    Help needed with Excel Chart-marker-options-built-type-circle.png
    4 Still in Marker options, Built-in, select a Size to suit you. Size 10 is pretty big and is roughly what you have drawn.
    5 Then Marker fill, No fill will match your illustration's circles but you can experiment to suit your needs.

    Denis
    thanks for your help, but i am sorry i could not explain my question properly, i want blue line to have red circles, lets say at 1.5 and 4.7 points of x-axis
      My Computer


  5. Posts : 16,949
    Windows 10 Home x64 Version 22H2 Build 19045.4170
       #5

    makhan10 said:
    thanks for your help, but i am sorry i could not explain my question properly, i want blue line to have red circles, lets say at 1.5 and 4.7 points of x-axis
    Excel does not provide for freehand drawing on charts.

    You could take a screenshot of your chart then edit it in, for example, MSPaint to add your circles.

    Denis
    Last edited by Try3; 10 Mar 2021 at 08:08.
      My Computer


  6. Posts : 298
    Win10 10.0.18362 Build 18362
    Thread Starter
       #6

    Try3 said:
    Excel does not provide for freehand drawing on charts.

    You could take a screenshot of your chart then edit it in, for example, MSPaint to add your circles.

    Denis
    ok thnx
      My Computer


  7. Posts : 16,949
    Windows 10 Home x64 Version 22H2 Build 19045.4170
       #7

    Sorry, I was wrong.

    Excel also provides for additional drawing on charts.

    Click on Excel's Insert tab,
    click on Shapes,
    select a circle or whatever else you want,
    click on the chart wherever you want,
    drag the circle into position & right-click on it to format it however you want.

    Denis
      My Computer


  Related Discussions
Our Sites
Site Links
About Us
Windows 10 Forums is an independent web site and has not been authorized, sponsored, or otherwise approved by Microsoft Corporation. "Windows 10" and related materials are trademarks of Microsoft Corp.

© Designer Media Ltd
All times are GMT -5. The time now is 02:32.
Find Us


Windows 10 Forums