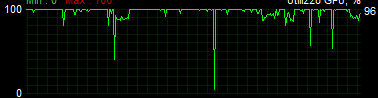
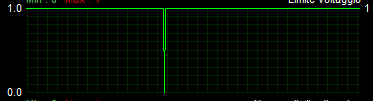
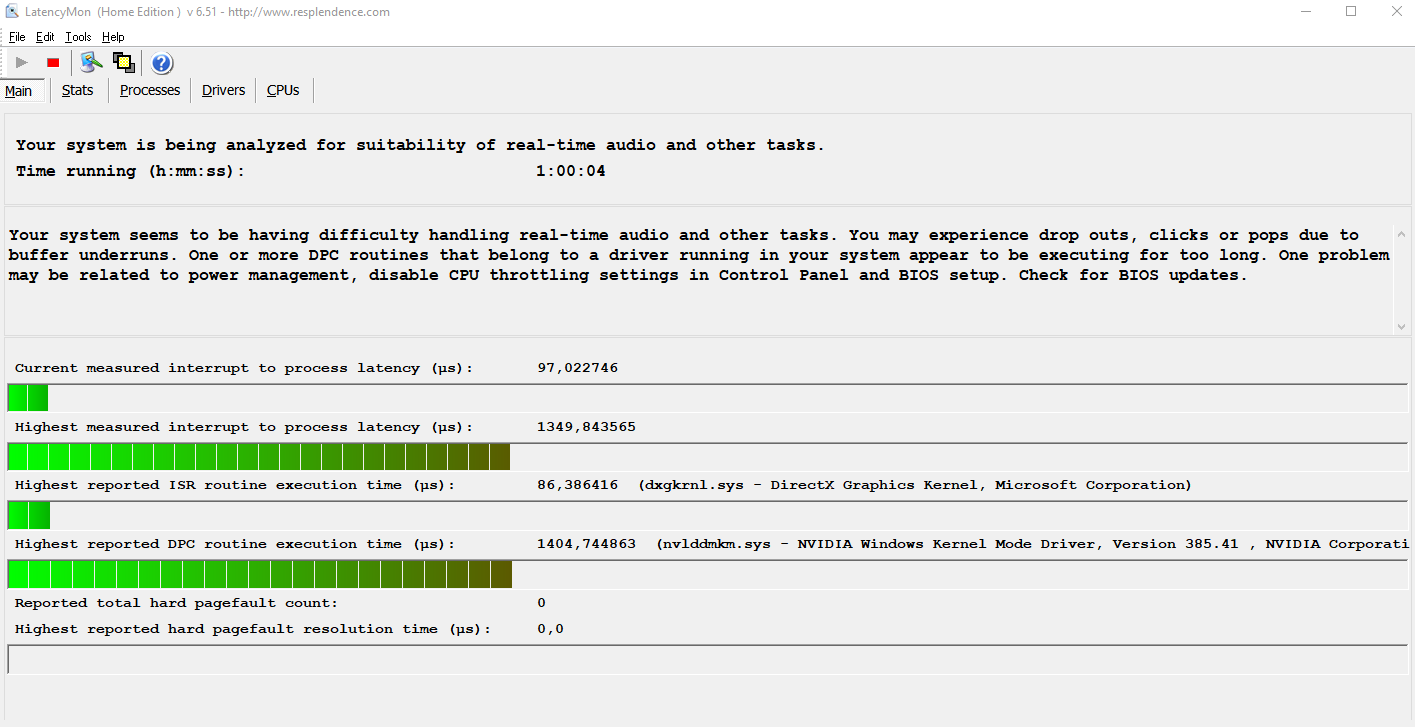
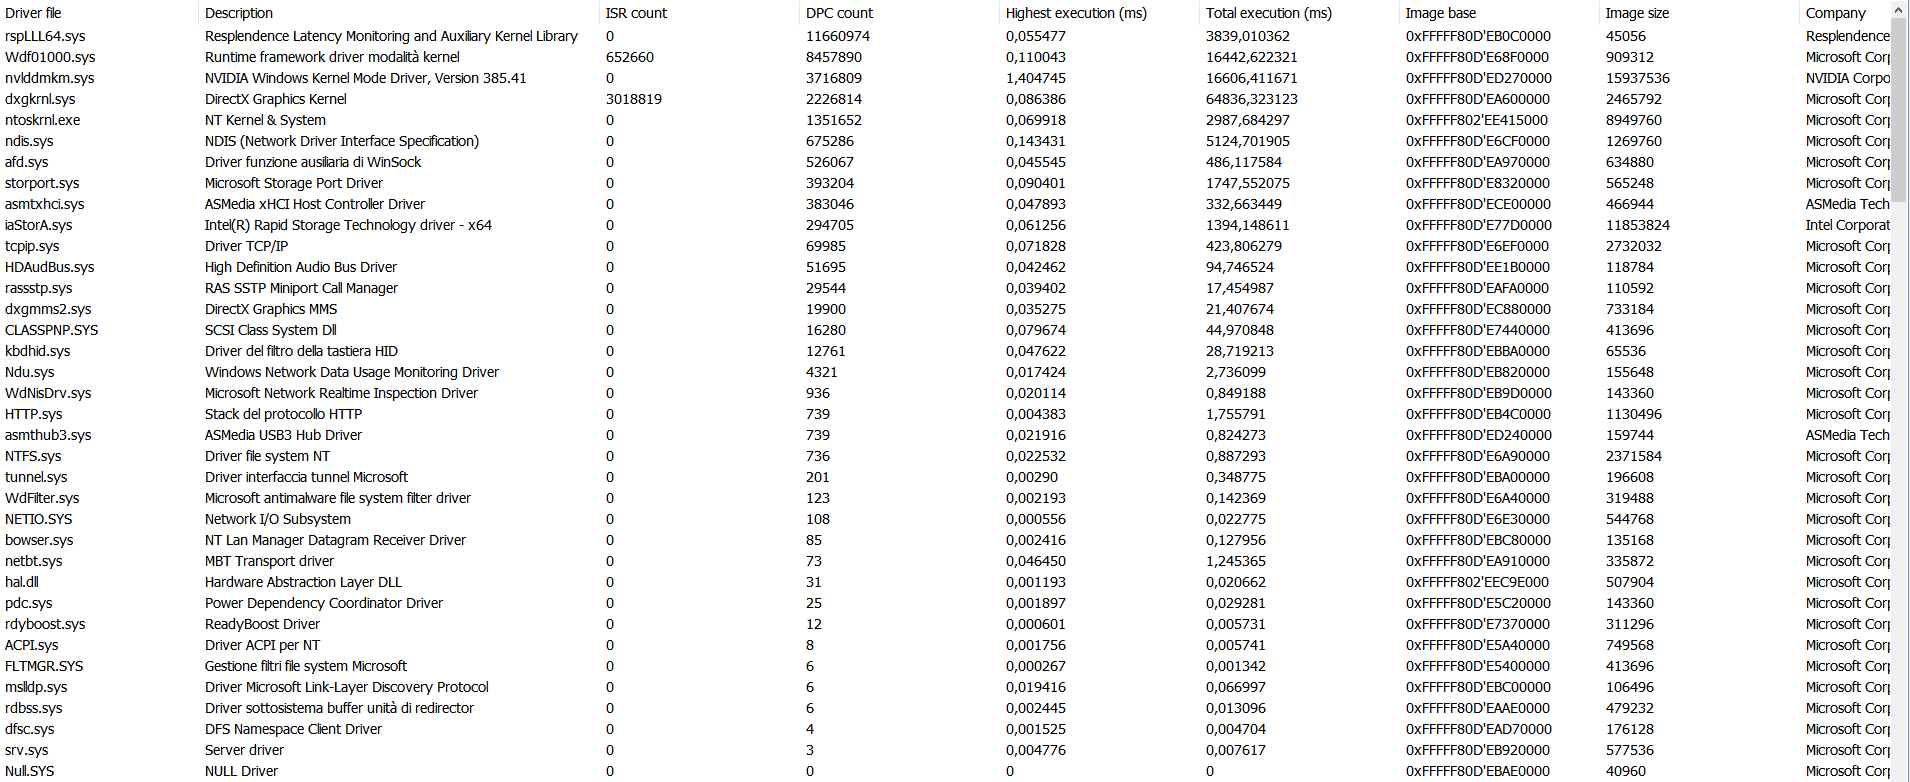
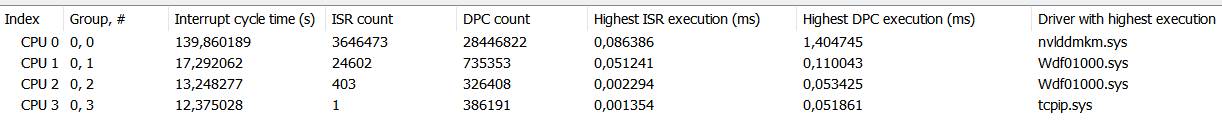
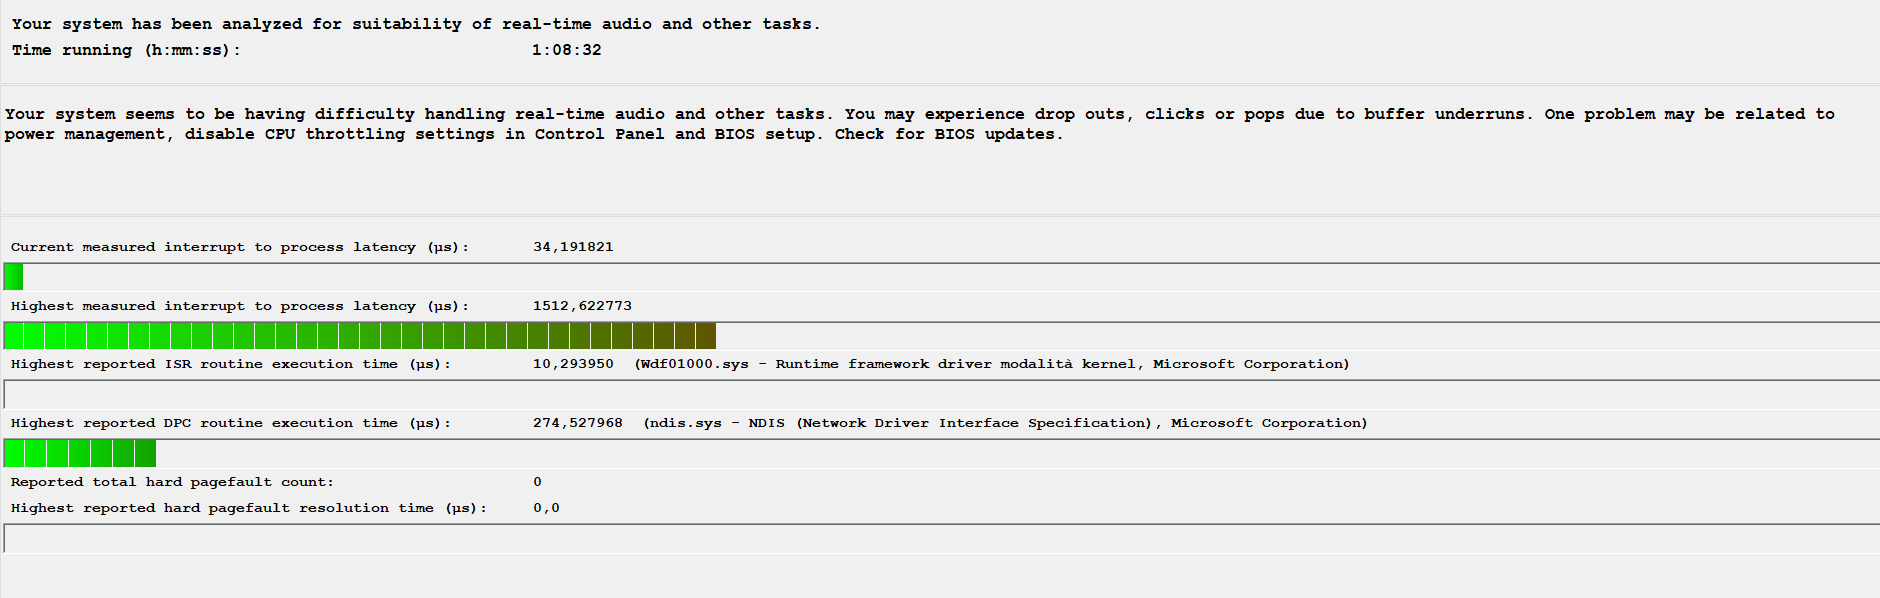
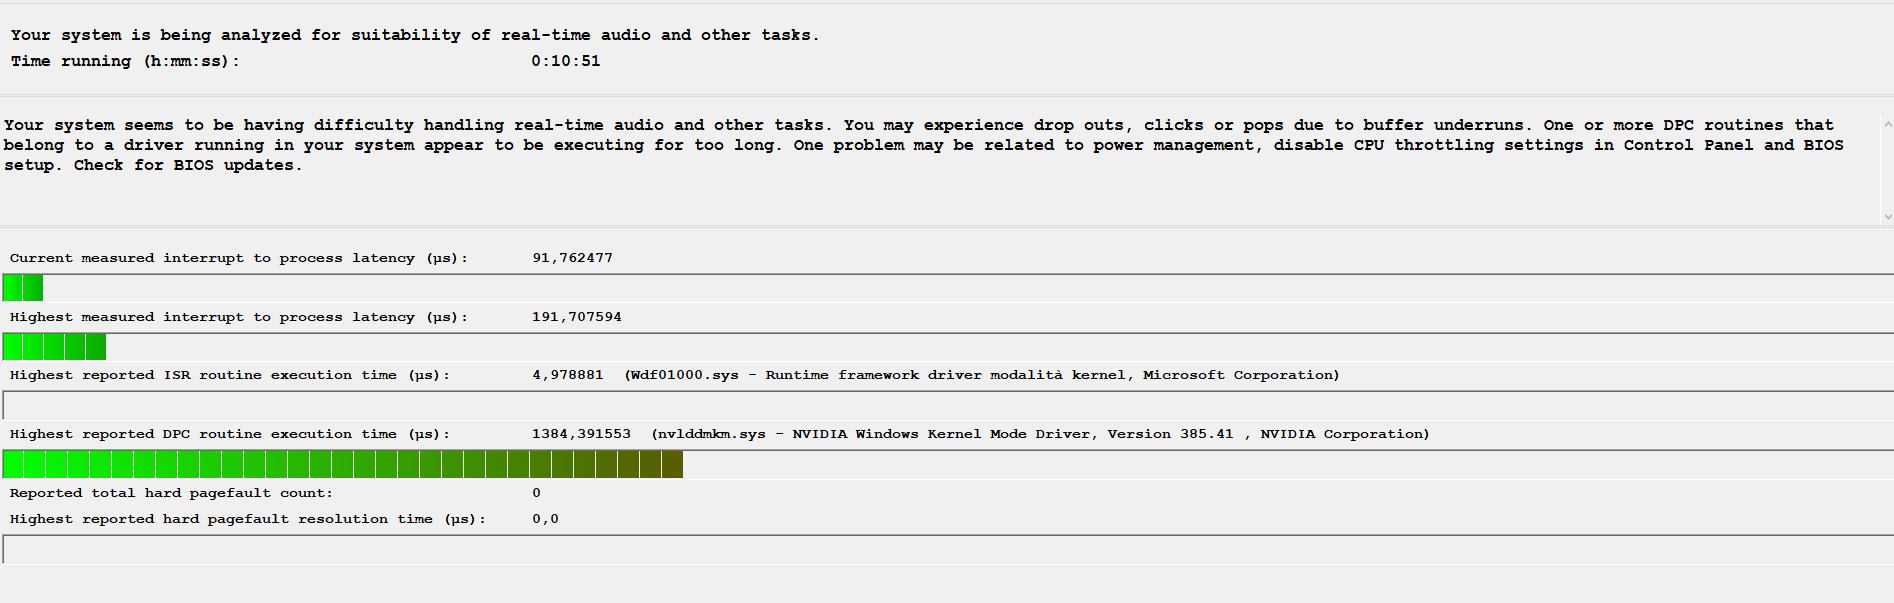
____________________________________________________________________________________________________ _____CONCLUSION_____________________________________________________________________________________ ____________________Your system seems to be having difficulty handling real-time audio and other tasks. You may experience drop outs, clicks or pops due to buffer underruns. One or more DPC routines that belong to a driver running in your system appear to be executing for too long. One problem may be related to power management, disable CPU throttling settings in Control Panel and BIOS setup. Check for BIOS updates. LatencyMon has been analyzing your system for 1:01:33 (h:mm:ss) on all processors._________________________________________________________________________________________ ________________SYSTEM INFORMATION_________________________________________________________________________________________ ________________Computer name: ANTONIO-PCOS version: Windows 10 , 10.0, build: 15063 (x64)Hardware: ASUSTeK COMPUTER INC., MAXIMUS VIII RANGERCPU: GenuineIntel Intel(R) Core(TM) i5-6600K CPU @ 3.50GHzLogical processors: 4Processor groups: 1RAM: 16322 MB total_______________________________________________________________________________________________ __________CPU SPEED_______________________________________________________________________________________________ __________Reported CPU speed: 3504 MHzMeasured CPU speed: 1 MHz (approx.)Note: reported execution times may be calculated based on a fixed reported CPU speed. Disable variable speed settings like Intel Speed Step and AMD Cool N Quiet in the BIOS setup for more accurate results.WARNING: the CPU speed that was measured is only a fraction of the CPU speed reported. Your CPUs may be throttled back due to variable speed settings and thermal issues. It is suggested that you run a utility which reports your actual CPU frequency and temperature. ____________________________________________________________________________________________________ _____MEASURED INTERRUPT TO USER PROCESS LATENCIES___________________________________________________________________________________________ ______________The interrupt to process latency reflects the measured interval that a usermode process needed to respond to a hardware request from the moment the interrupt service routine started execution. This includes the scheduling and execution of a DPC routine, the signaling of an event and the waking up of a usermode thread from an idle wait state in response to that event.Highest measured interrupt to process latency (µs): 1349,843565Average measured interrupt to process latency (µs): 1,845068Highest measured interrupt to DPC latency (µs): 1348,090142Average measured interrupt to DPC latency (µs): 0,570723____________________________________________________________________________________________ _____________ REPORTED ISRs________________________________________________________________________________________________ _________Interrupt service routines are routines installed by the OS and device drivers that execute in response to a hardware interrupt signal.Highest ISR routine execution time (µs): 86,386416Driver with highest ISR routine execution time: dxgkrnl.sys - DirectX Graphics Kernel, Microsoft CorporationHighest reported total ISR routine time (%): 0,335271Driver with highest ISR total time: dxgkrnl.sys - DirectX Graphics Kernel, Microsoft CorporationTotal time spent in ISRs (%) 0,339808ISR count (execution time <250 µs): 3671479ISR count (execution time 250-500 µs): 0ISR count (execution time 500-999 µs): 0ISR count (execution time 1000-1999 µs): 0ISR count (execution time 2000-3999 µs): 0ISR count (execution time >=4000 µs): 0___________________________________________________________________________________________________ ______REPORTED DPCs________________________________________________________________________________________________ _________DPC routines are part of the interrupt servicing dispatch mechanism and disable the possibility for a process to utilize the CPU while it is interrupted until the DPC has finished execution.Highest DPC routine execution time (µs): 1404,744863Driver with highest DPC routine execution time: nvlddmkm.sys - NVIDIA Windows Kernel Mode Driver, Version 385.41 , NVIDIA CorporationHighest reported total DPC routine time (%): 0,103547Driver with highest DPC total execution time: dxgkrnl.sys - DirectX Graphics Kernel, Microsoft CorporationTotal time spent in DPCs (%) 0,434736DPC count (execution time <250 µs): 29894759DPC count (execution time 250-500 µs): 0DPC count (execution time 500-999 µs): 0DPC count (execution time 1000-1999 µs): 15DPC count (execution time 2000-3999 µs): 0DPC count (execution time >=4000 µs): 0___________________________________________________________________________________________________ ______ REPORTED HARD PAGEFAULTS__________________________________________________________________________________________ _______________Hard pagefaults are events that get triggered by making use of virtual memory that is not resident in RAM but backed by a memory mapped file on disk. The process of resolving the hard pagefault requires reading in the memory from disk while the process is interrupted and blocked from execution.Process with highest pagefault count: noneTotal number of hard pagefaults 0Hard pagefault count of hardest hit process: 0Highest hard pagefault resolution time (µs): 0,0Total time spent in hard pagefaults (%): 0,0Number of processes hit: 0___________________________________________________________________________________________________ ______ PER CPU DATA________________________________________________________________________________________________ _________CPU 0 Interrupt cycle time (s): 139,860190CPU 0 ISR highest execution time (µs): 86,386416CPU 0 ISR total execution time (s): 50,154502CPU 0 ISR count: 3646473CPU 0 DPC highest execution time (µs): 1404,744863CPU 0 DPC total execution time (s): 57,891105CPU 0 DPC count: 28446822____________________________________________________________________________________________ _____________CPU 1 Interrupt cycle time (s): 17,292063CPU 1 ISR highest execution time (µs): 51,241438CPU 1 ISR total execution time (s): 0,051019CPU 1 ISR count: 24602CPU 1 DPC highest execution time (µs): 110,043379CPU 1 DPC total execution time (s): 4,438598CPU 1 DPC count: 735353______________________________________________________________________________________________ ___________CPU 2 Interrupt cycle time (s): 13,248277CPU 2 ISR highest execution time (µs): 2,293950CPU 2 ISR total execution time (s): 0,000429CPU 2 ISR count: 403CPU 2 DPC highest execution time (µs): 53,425228CPU 2 DPC total execution time (s): 0,754023CPU 2 DPC count: 326408______________________________________________________________________________________________ ___________CPU 3 Interrupt cycle time (s): 12,375028CPU 3 ISR highest execution time (µs): 1,354452CPU 3 ISR total execution time (s): 0,000001CPU 3 ISR count: 1CPU 3 DPC highest execution time (µs): 51,860731CPU 3 DPC total execution time (s): 1,147759CPU 3 DPC count: 386191______________________________________________________________________________________________ ___________


 Quote
Quote