
New
#21
That startup list is quite big compared to mine.
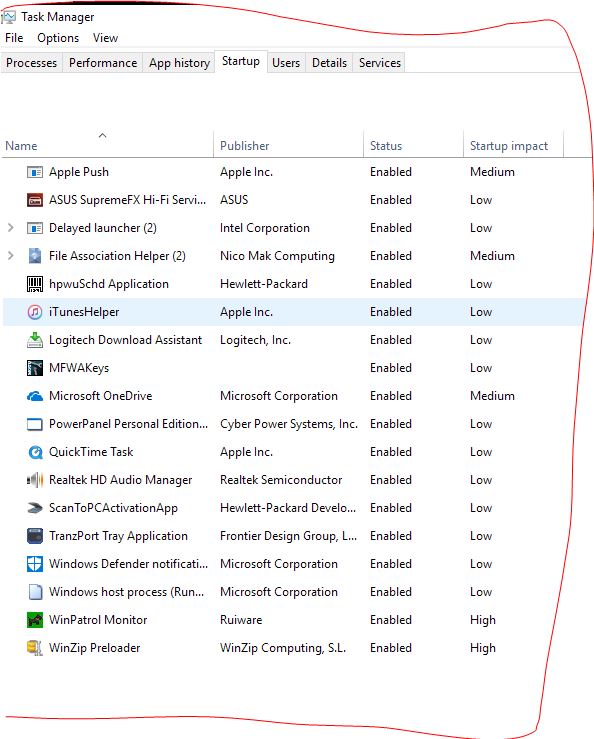
What? Your lists are really long compared to mine, and I should clean mine up too.
Don't you use your machines for much?Add a few apps from Adobe and you'll soon have heaps in there. Add Spotify and iTunes and a few bits of software here and there and it soon mounts up.
Seriously though it does irritate me how many programs think they need to run at startup regardless of whether I use them from one day to the next.
Hahhah, I use my machine for a lot of things, but I kill everything that wants to exist in the startup entries. I mostly use portable apps or make them portable and Adobe tools and many apps like iTunes or other "wanna do it all for you"-tools are beasts which I avoid at all cost.
Most startups has to do with app optimizations, or update services.
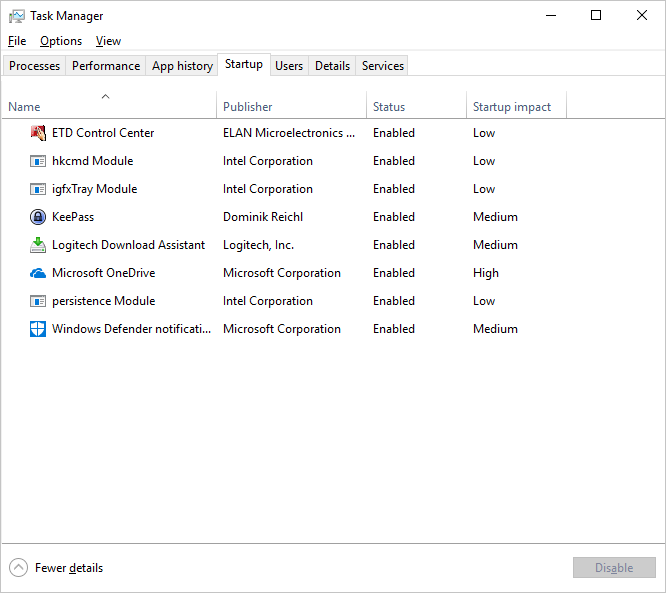
LOL, my other machine has 2 startup entries:
1. OneDrive
2. Windows Defender Notifications
My computer is used for my home recording studio DAW. DPC latency mon reports no problems.
That is something Mark should run and see if it reports any or what issues.
Resplendence Software - LatencyMon: suitability checker for real-time audio and other tasks
I just ran LatencyMon.
____________________________________________________________________________________________________ _____
CONCLUSION
____________________________________________________________________________________________________ _____
Your system appears to be suitable for handling real-time audio and other tasks without dropouts.
LatencyMon has been analyzing your system for 0:01:08 (h:mm:ss) on all processors.
____________________________________________________________________________________________________ _____
SYSTEM INFORMATION
____________________________________________________________________________________________________ _____
Computer name: OFFICE-DESKTOP
OS version: Windows 10 , 10.0, build: 14393 (x64)
Hardware: P5Q-WS, , ASUSTeK Computer INC.
CPU: GenuineIntel Intel(R) Core(TM)2 Duo CPU E8400 @ 3.00GHz
Logical processors: 2
Processor groups: 1
RAM: 8191 MB total
____________________________________________________________________________________________________ _____
CPU SPEED
____________________________________________________________________________________________________ _____
Reported CPU speed: 30 MHz
Note: reported execution times may be calculated based on a fixed reported CPU speed. Disable variable speed settings like Intel Speed Step and AMD Cool N Quiet in the BIOS setup for more accurate results.
____________________________________________________________________________________________________ _____
MEASURED INTERRUPT TO USER PROCESS LATENCIES
____________________________________________________________________________________________________ _____
The interrupt to process latency reflects the measured interval that a usermode process needed to respond to a hardware request from the moment the interrupt service routine started execution. This includes the scheduling and execution of a DPC routine, the signaling of an event and the waking up of a usermode thread from an idle wait state in response to that event.
Highest measured interrupt to process latency (µs): 247.836382
Average measured interrupt to process latency (µs): 3.485918
Highest measured interrupt to DPC latency (µs): 219.843843
Average measured interrupt to DPC latency (µs): 1.405934
____________________________________________________________________________________________________ _____
REPORTED ISRs
____________________________________________________________________________________________________ _____
Interrupt service routines are routines installed by the OS and device drivers that execute in response to a hardware interrupt signal.
Highest ISR routine execution time (µs): 61.4760
Driver with highest ISR routine execution time: ataport.SYS - ATAPI Driver Extension, Microsoft Corporation
Highest reported total ISR routine time (%): 0.096775
Driver with highest ISR total time: ataport.SYS - ATAPI Driver Extension, Microsoft Corporation
Total time spent in ISRs (%) 0.187880
ISR count (execution time <250 µs): 64437
ISR count (execution time 250-500 µs): 0
ISR count (execution time 500-999 µs): 0
ISR count (execution time 1000-1999 µs): 0
ISR count (execution time 2000-3999 µs): 0
ISR count (execution time >=4000 µs): 0
____________________________________________________________________________________________________ _____
REPORTED DPCs
____________________________________________________________________________________________________ _____
DPC routines are part of the interrupt servicing dispatch mechanism and disable the possibility for a process to utilize the CPU while it is interrupted until the DPC has finished execution.
Highest DPC routine execution time (µs): 211.9740
Driver with highest DPC routine execution time: tcpip.sys - TCP/IP Driver, Microsoft Corporation
Highest reported total DPC routine time (%): 0.261701
Driver with highest DPC total execution time: USBPORT.SYS - USB 1.1 & 2.0 Port Driver, Microsoft Corporation
Total time spent in DPCs (%) 1.14770
DPC count (execution time <250 µs): 167434
DPC count (execution time 250-500 µs): 0
DPC count (execution time 500-999 µs): 0
DPC count (execution time 1000-1999 µs): 0
DPC count (execution time 2000-3999 µs): 0
DPC count (execution time >=4000 µs): 0
____________________________________________________________________________________________________ _____
REPORTED HARD PAGEFAULTS
____________________________________________________________________________________________________ _____
Hard pagefaults are events that get triggered by making use of virtual memory that is not resident in RAM but backed by a memory mapped file on disk. The process of resolving the hard pagefault requires reading in the memory from disk while the process is interrupted and blocked from execution.
NOTE: some processes were hit by hard pagefaults. If these were programs producing audio, they are likely to interrupt the audio stream resulting in dropouts, clicks and pops. Check the Processes tab to see which programs were hit.
Process with highest pagefault count: compattelrunner.exe
Total number of hard pagefaults 7610
Hard pagefault count of hardest hit process: 7504
Highest hard pagefault resolution time (µs): 526022.2140
Total time spent in hard pagefaults (%): 29.200763
Number of processes hit: 10
____________________________________________________________________________________________________ _____
PER CPU DATA
____________________________________________________________________________________________________ _____
CPU 0 Interrupt cycle time (s): 2.508446
CPU 0 ISR highest execution time (µs): 61.4760
CPU 0 ISR total execution time (s): 0.254850
CPU 0 ISR count: 63520
CPU 0 DPC highest execution time (µs): 211.9740
CPU 0 DPC total execution time (s): 1.520364
CPU 0 DPC count: 162757
____________________________________________________________________________________________________ _____
CPU 1 Interrupt cycle time (s): 0.223761
CPU 1 ISR highest execution time (µs): 13.6170
CPU 1 ISR total execution time (s): 0.003016
CPU 1 ISR count: 917
CPU 1 DPC highest execution time (µs): 197.6070
CPU 1 DPC total execution time (s): 0.054854
CPU 1 DPC count: 4677
____________________________________________________________________________________________________ _____
What do you show in the "Processes" window in Latency Mon. Also let it run for about 5 minutes (maybe longer until it starts doing the speed up).
Okey dokey, I've run it for 15 minutes now:
As for____________________________________________________________________________________________________ _____
CONCLUSION
____________________________________________________________________________________________________ _____
Your system appears to be having trouble handling real-time audio and other tasks. You are likely to experience buffer underruns appearing as drop outs, clicks or pops. One or more DPC routines that belong to a driver running in your system appear to be executing for too long. Also one or more ISR routines that belong to a driver running in your system appear to be executing for too long. One problem may be related to power management, disable CPU throttling settings in Control Panel and BIOS setup. Check for BIOS updates.
LatencyMon has been analyzing your system for 0:15:00 (h:mm:ss) on all processors.
____________________________________________________________________________________________________ _____
SYSTEM INFORMATION
____________________________________________________________________________________________________ _____
Computer name: OFFICE-DESKTOP
OS version: Windows 10 , 10.0, build: 14393 (x64)
Hardware: P5Q-WS, , ASUSTeK Computer INC.
CPU: GenuineIntel Intel(R) Core(TM)2 Duo CPU E8400 @ 3.00GHz
Logical processors: 2
Processor groups: 1
RAM: 8191 MB total
____________________________________________________________________________________________________ _____
CPU SPEED
____________________________________________________________________________________________________ _____
Reported CPU speed: 30 MHz
Note: reported execution times may be calculated based on a fixed reported CPU speed. Disable variable speed settings like Intel Speed Step and AMD Cool N Quiet in the BIOS setup for more accurate results.
____________________________________________________________________________________________________ _____
MEASURED INTERRUPT TO USER PROCESS LATENCIES
____________________________________________________________________________________________________ _____
The interrupt to process latency reflects the measured interval that a usermode process needed to respond to a hardware request from the moment the interrupt service routine started execution. This includes the scheduling and execution of a DPC routine, the signaling of an event and the waking up of a usermode thread from an idle wait state in response to that event.
Highest measured interrupt to process latency (µs): 1638.929019
Average measured interrupt to process latency (µs): 3.089879
Highest measured interrupt to DPC latency (µs): 1519.790042
Average measured interrupt to DPC latency (µs): 1.222641
____________________________________________________________________________________________________ _____
REPORTED ISRs
____________________________________________________________________________________________________ _____
Interrupt service routines are routines installed by the OS and device drivers that execute in response to a hardware interrupt signal.
Highest ISR routine execution time (µs): 4901.4090
Driver with highest ISR routine execution time: HDAudBus.sys - High Definition Audio Bus Driver, Microsoft Corporation
Highest reported total ISR routine time (%): 0.085718
Driver with highest ISR total time: ataport.SYS - ATAPI Driver Extension, Microsoft Corporation
Total time spent in ISRs (%) 0.189172
ISR count (execution time <250 µs): 1138450
ISR count (execution time 250-500 µs): 0
ISR count (execution time 500-999 µs): 6
ISR count (execution time 1000-1999 µs): 1
ISR count (execution time 2000-3999 µs): 1
ISR count (execution time >=4000 µs): 0
____________________________________________________________________________________________________ _____
REPORTED DPCs
____________________________________________________________________________________________________ _____
DPC routines are part of the interrupt servicing dispatch mechanism and disable the possibility for a process to utilize the CPU while it is interrupted until the DPC has finished execution.
Highest DPC routine execution time (µs): 2044.170
Driver with highest DPC routine execution time: dxgkrnl.sys - DirectX Graphics Kernel, Microsoft Corporation
Highest reported total DPC routine time (%): 0.224516
Driver with highest DPC total execution time: Wdf01000.sys - Kernel Mode Driver Framework Runtime, Microsoft Corporation
Total time spent in DPCs (%) 1.366550
DPC count (execution time <250 µs): 3627366
DPC count (execution time 250-500 µs): 0
DPC count (execution time 500-999 µs): 183
DPC count (execution time 1000-1999 µs): 6
DPC count (execution time 2000-3999 µs): 1
DPC count (execution time >=4000 µs): 0
____________________________________________________________________________________________________ _____
REPORTED HARD PAGEFAULTS
____________________________________________________________________________________________________ _____
Hard pagefaults are events that get triggered by making use of virtual memory that is not resident in RAM but backed by a memory mapped file on disk. The process of resolving the hard pagefault requires reading in the memory from disk while the process is interrupted and blocked from execution.
NOTE: some processes were hit by hard pagefaults. If these were programs producing audio, they are likely to interrupt the audio stream resulting in dropouts, clicks and pops. Check the Processes tab to see which programs were hit.
Process with highest pagefault count: syncbackse.exe
Total number of hard pagefaults 157972
Hard pagefault count of hardest hit process: 155427
Highest hard pagefault resolution time (µs): 533387.1930
Total time spent in hard pagefaults (%): 35.263423
Number of processes hit: 45
____________________________________________________________________________________________________ _____
PER CPU DATA
____________________________________________________________________________________________________ _____
CPU 0 Interrupt cycle time (s): 38.693168
CPU 0 ISR highest execution time (µs): 4901.4090
CPU 0 ISR total execution time (s): 2.987175
CPU 0 ISR count: 936393
CPU 0 DPC highest execution time (µs): 2044.170
CPU 0 DPC total execution time (s): 21.936094
CPU 0 DPC count: 3437229
____________________________________________________________________________________________________ _____
CPU 1 Interrupt cycle time (s): 6.166001
CPU 1 ISR highest execution time (µs): 2394.4710
CPU 1 ISR total execution time (s): 0.419291
CPU 1 ISR count: 202068
CPU 1 DPC highest execution time (µs): 685.5810
CPU 1 DPC total execution time (s): 2.671638
CPU 1 DPC count: 190327
____________________________________________________________________________________________________ _____
Erm... lots and lots of them. There doesn't seem to be a way of exporting that information though short of doing lots of screen shots.
(there are lots of cscript.exe items - several screen shots missed out...)
Your AVG and Firefox are creating a lot of hard pagefaults. I've tried AVG multiple time and I had to remove it completely because I run into a lot of issues with it. Computer ran very slow and was stuttering like crazy.
I used to like Firefox, but I have recently had issues with that too. They changed something internally in it in the latest versions and the only reliable browser for me currently has been Chrome.


 Quote
Quote


